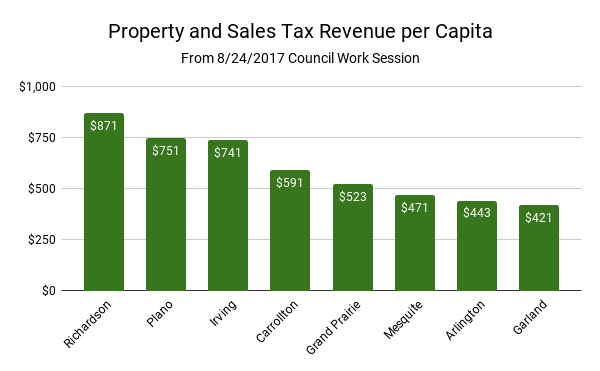
The graph above is, in my belief, one of the most important graphs for the City of Garland. It provides much important data relating to the future of our city.
First, we lag behind our peer cities as far as property and sales tax revenue per capita. Our neighboring city to the west Richardson is more than double our revenue. The average for the Metroplex is $627 — with Garland more than one-third less than the average.
Second, this lack of a strong revenue base makes it tough for the city to make budgeting choices which allow the city to progress as quickly as its peers. With tax revenue is this low, I commend Garland’s city staff for maximizing the services provided to it’s citizens.
The police and fire department bravely cover all of Garland’s 57.1 square miles to provide safety to its citizens. Garbage and bulk trash pickup is provided weekly. Libraries are open five days a week with the central library open seven days providing educational resources and internet access to all citizens. Recreation centers are open six days a week with great activities and programming for our youth. This is all a result of Garland’s city staff doing more with less than any other city around us. They should all be commended for their great work.
As your representative for District 7, I will make it my duty each day to work to improve this graph. This means helping to improve property values by creating thriving, vibrant neighborhoods that attract residents. It means attracting businesses to provide shopping opportunities to our city and sales tax revenue to our bottom line. And it means being fiscally responsible for the revenue we do have. We, as a city, cannot afford to waste one dime, because our future depends on it.
At the end of each blog post, I will add a musical selection. Let’s keep this campaign positive and fun.
